All Articles

Drawing polygons with style

Polygons Styled on the Fly

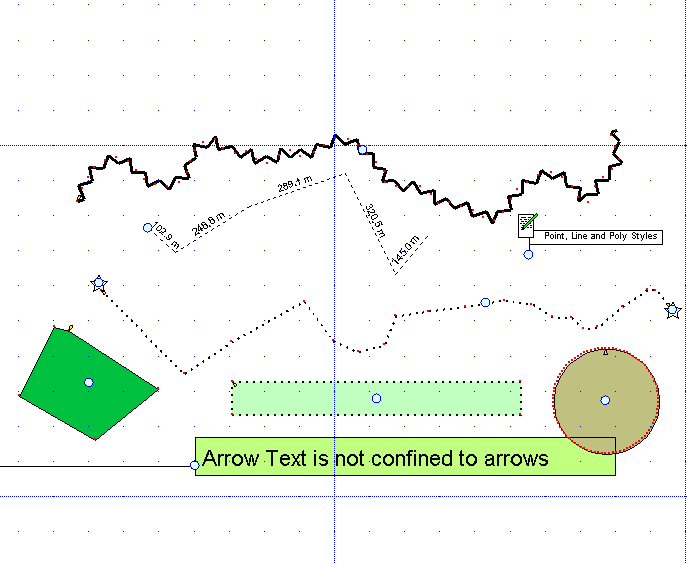
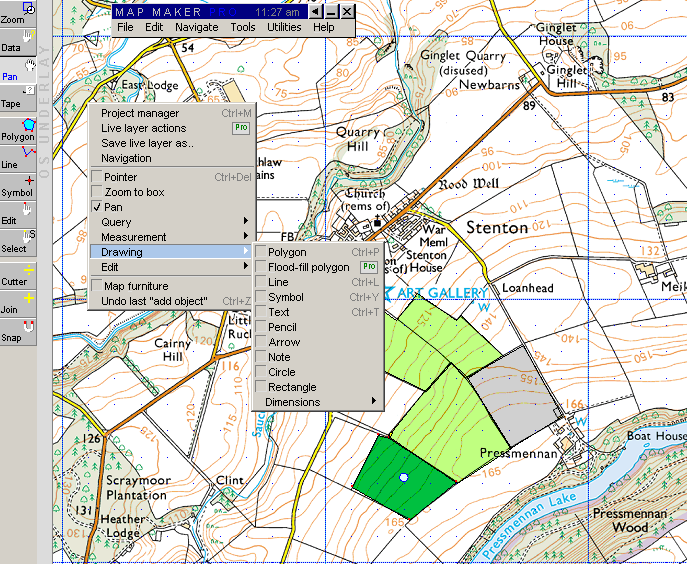
Drawing polygons is much like drawing lines.  Click the polygon draw tool and click each vertex (corner, or suitable bend in a curve) until you are ready to close the polygon with a double click on the start node, OR just right click and automagically it will find the start node. As with line drawing you can correct errors using backspace.  Esc(ape) will delete your current drawing, but not the earlier polygons.

Once you’ve closed a polygon, you can chose the basic attributes as with a Line feature. In the Line example, we didn’t explain the edit project style set option, or how to create a new style.

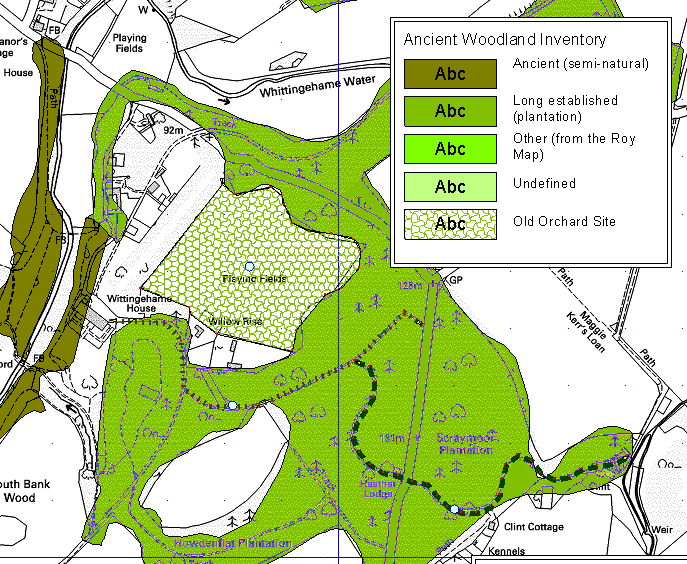
When you create a set of lines or polygons you will want to extend the preset styles or re-style the default style set entirely.  Take care not to inadvertently overwrite your default style, the modifications will alter subsequent projects you create. Either permanently modify the project’s defaults, call up another style to use or create a specific set to use / re-use in this and future projects.

The presets are handy but basic, but making your own requires a bit of thought, simply, because each style set must be designed with presentation in mind. When entering data, it is tempting to style as you go, but unless you are entering a very small amount of data it pays to devise your styles before you start entering data or apply a set after you have entered it (but only if the number of styles matches your defaults).

In the dialogue box, instead of picking an existing style you edit the project style set.  Then, remembering to first go to the Style Management tab, add or delete styles to match the number you need.  Unless you are recycling a style set, you may as well delete the lot bar one (the last one cannot be deleted.)

Once the new styles are added, they won’t look right straight away, you need to configure each one.

You need to go to the Style Edit tab to edit them.

Take care, because each style carries details across other vector types.

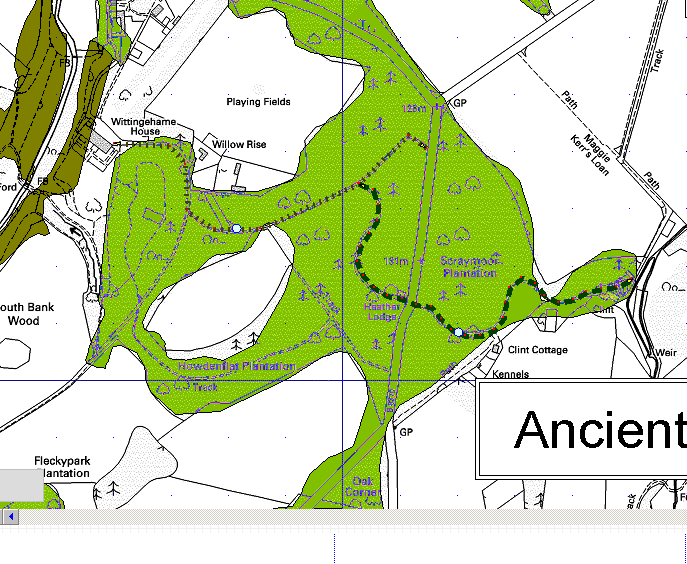
A bit confusing but your line style influences the polygon boundary style with the same name.  The best way to think about this is that Trees can occur as a polygon (a woodland), a line (a field boundary or hedge), a point (a single tree, or cluster of trees).

Drawing your first lines

Drawing options are available from the tool bar and extended options are in the Context Menu > Draw > Etc (remember: right click pulls up a context specific menu.)  Here under Draw you’ll find Pencil, Rectangle, Circle, and Measurement tools.

Line and Pencil Tools

Drawing Lines is useful for mapping linear features like roads and paths, obviously.  Roads and paths typically join up in networks. Lines can be styled and there are a range of default line styles available that cover many basic requirements.

Getting lines to join up correctly is not easy by eye.  Setting Edit > Live Layer Options > When drawing, snap vertices to > will resolve almost all the circumstances you are likely to encounter!

To draw lines there are 2 basic options, the :

  1. line tool (from the toolbar) click the start and each vertex – useful for straight features
  2. pencil tool (context menu only) click and draw – useful for wiggly features – check the image on the right where we’ve cheated and styled the lines to make them look nice

Note that each tool behaves slightly differently.  Clicking each vertex with the Line Tool allows you to position the next vertex reasonably accurately.  You can correct errors one at a time using the back space as you click. If you make a hash of your line, simply press Esc(ape) to start again. To finish your line, click the last position and drag the pointer away and right click. The line is terminated at the previous left click and you will be prompted to:

  1. chose a line Style (we’ll learn how to make your own in a bit)
  2. change the Display Label or Unique Id
  3. Modify the Data tab (More later)
  4. Select from a range of Actions (More later)

If it looks terrible at this stage, you can still remove ugliness quickly with the keyboard combination CTRL+Z. Many times,  it is a great deal easier to start a fresh line or polygon than to try and edit a clumsily drawn one.

The Pencil Tool is slightly different, as you have to hold the pencil down and it offers no incremental deletion option. To finish your line, simply release the mouse exactly where you want it terminated.   When the Pencil Tool is terminated you get exactly the same tabbed options as the Line Tool.  That’s because Pencil Lines are saved as a Line type.

Because even apparently curved
lines are made up of straight line segments, you may wish to alter the spacing of the
vertices to create a smoother pencil line. Go to File – System set up – Preferences –
Miscellaneous and adjust the value of Spacing of vertices in pixels for the pencil tool.

Curved lines are made up of straight line segments, so you may need to alter the spacing of the vertices to create a smoother pencil line.  File > System set up > Preferences > Miscellaneous and set Spacing of vertices in pixels for the pencil tool.

Nota Bene

Remember to chose your digitising scale appropriately.  Drawing lines at 1:50k will make your features appear to be several metres wide – fine if this is going to be the final presentation scale. Zoom in to 1:10k and your beautiful networks start look badly drawn, with gaps appearing at junctions and jagged lines.  However digitising at 1:10k or below will take a lot longer, so you may need to compromise depending on the accuracy and precision required.

Polygons appear to form between the lines in such networks, don’t go crazy trying to click an object which doesn’t actually exist.

Objects in the Live Layer have tell tale blue dots which will come in handy when you want to modify / edit a feature.

Mixing your data types

Mixing Data Types
Mixing Data Types

You know what they say about mixing your drinks?

Map Maker allows you to mix points, lines and polygons, but for serious data collection purposes this is to be discouraged. Map Maker has 2 other vector types Text and Rulers, so mixing can be hazardous.  If you have used on-line mapping applications, like Google Maps, you will see the immediate benefits of data layer separation.

One obvious advantage is that you can create a range of different maps quite easily from the multiple data sets you’ve just created, even though you can set the styles of lines quite independently within a single layer too.

So, it is always good practice that each layer contain only a discrete set of data e.g. a set of lines representing paths should be separate from a set of lines representing roads.

While further differentiation between road types is possible using styles, consider whether analyses, presentations or maps might benefit from separation.

Also if you maintain a range of discrete /  smaller data sets, it won’t take so long to recover them, should they get corrupted, deleted or otherwise lost.  You can always merge layers later, if need be.

The illustration shows a range of the vector data types that Map Maker supports (Polygon, Line, Symbol or Point, Measurement, Pencil, Rectangle, Circle, Note).

Save your data!

Drawing in Map Maker

It is really easy to start drawing in Map Maker.  Simply select a tool and start drawing. More tools are visible in the Context Menu (right click, select Draw).

When you trace a polygon from an aerial photo, you are not drawing on the image itself, as you would in Paint, but creating a new vector data set.

In Map Maker you draw in the Live Layer and only in this layer.  You do not draw on any of the other layers, as in Photoshop or Illustrator.

This turns out to be quite useful, as it stops you from inadvertently adding data to a different layer than intended – e.g. corrupting a core data set.

The Live Layer is empty until you start drawing on it.

You can load previously saved data set into the Live Layer, any vector data set or transfer data from an existing layer.

Before long you will want to save your hard work.  There are several options for saving it and this is where some discipline is required.  In Map Maker you save your Live Layer data in Map Maker’s native format (.dra).  You can export .dra data to other formats via Utilities, but for now we are going to stick exclusively with the .dra format.

Save your  Live Layer Option 1: right click and select Save Live Layer As.  Remember to store all your data in your own project working space (away from core data), creating sub directories to keep all your associated files in one place.

Save your  Live Layer Option 2: in the layer bar (the left hand vertical one) hover over the small white circle to reveal the Live Layer options.  Select Save Live Layer As

Save your  Live Layer Option 3: most Live Layer options can be found in the edit menu.  Select Save Live Layer

Once you’ve saved your first set of lines or polygons, you’ll notice that a new layer is created with the same name you selected for the save.  Also, the Live Layer is emptied on save, even though you may not have finished the job in hand.

If you are drawing within a project, you may need to Save Project to see the new layer.

To add more data to the new layer you must either transfer it back to the Live Layer (Copy to Live Layer or Load file into Live Layer), or simply add data to the  Live Layer as before and then Append it to the previously created layer (Add Live Layer to).

Two further options exist: save your new data as a separate layer entirely with a different name and join them up later,  and/or transfer the layer back to the Live Layer, but then save the data with a new file version, starting from e.g. my-new-layer-001.dra, and increase the number on each save.

Depending on your working preferences, the complexity of the task in hand you have 2 main options for managing new layers: versioning (using incremental file names) or creating discrete layers (to review and merge later).  You don’t have to over do it.

Always be disciplined about saving data and projects and store new information in your own project space (it is easy to lose your data from one session to the next in the Windows folder labyrinth).

Important Notice

Save Live Layer has a number of Edit options, which must be set – or you will tear your hair out in frustration.

Edit > Live Layer Options > Save Options select “prompt to save the live layer” should your clear a project or exit.  Select the last option to save the database at the same time.

Frustration will be caused by:

  • Using Clear Live Layer to end a drawing session – it will NOT always prompt you to save.
  • saving a Project believing it will also save the Live Layer – Projects are just list of file references and until you save the Live Layer it cannot be referenced by the Project
  • saving a Live Layer and it fails to transfer to a fully fledged Layer on screen – an intermittent Map Maker bug – if this happens, beware of saving a blank Live Layer over your previously saved layer – the software prompts so think first and don’t erase your hard work!
  • drawing after an error has occurred.  Always always save your work and restart the program, before drawing if you’ve experienced any strange behaviour with Map Maker!

Thankfully, Live Layers are recovered after a crash, but if other errors keep recurring save everything, exit and start the program again.  Or start the layer from scratch.

Printing a map

Exercise 1.9: Print your Map

Printing options are many, but we are going to stick to the easy options.

Print Woodland Map
Print Woodland Map
  1. From the File menu select Print
  2. Make sure the view is Landscape and select Scaled Print
  3. Select the Automatic tab and then select the first of the automatic template styles, click Preview
  4. When ready to print click Next, make sure you’ve selected a suitable printer, that it is turned on, and only then Print