Exercise 1.3: Navigate to Whittinghame House Woodlands
Now navigate using the zoom and pan tools to the area around Whittinghame House.
Whittinghame House Project Example
Select an area so that Lady Eleanor’s Cottage is roughly in the top left corner and Ruchlaw West Mains in the bottom right hand corner.
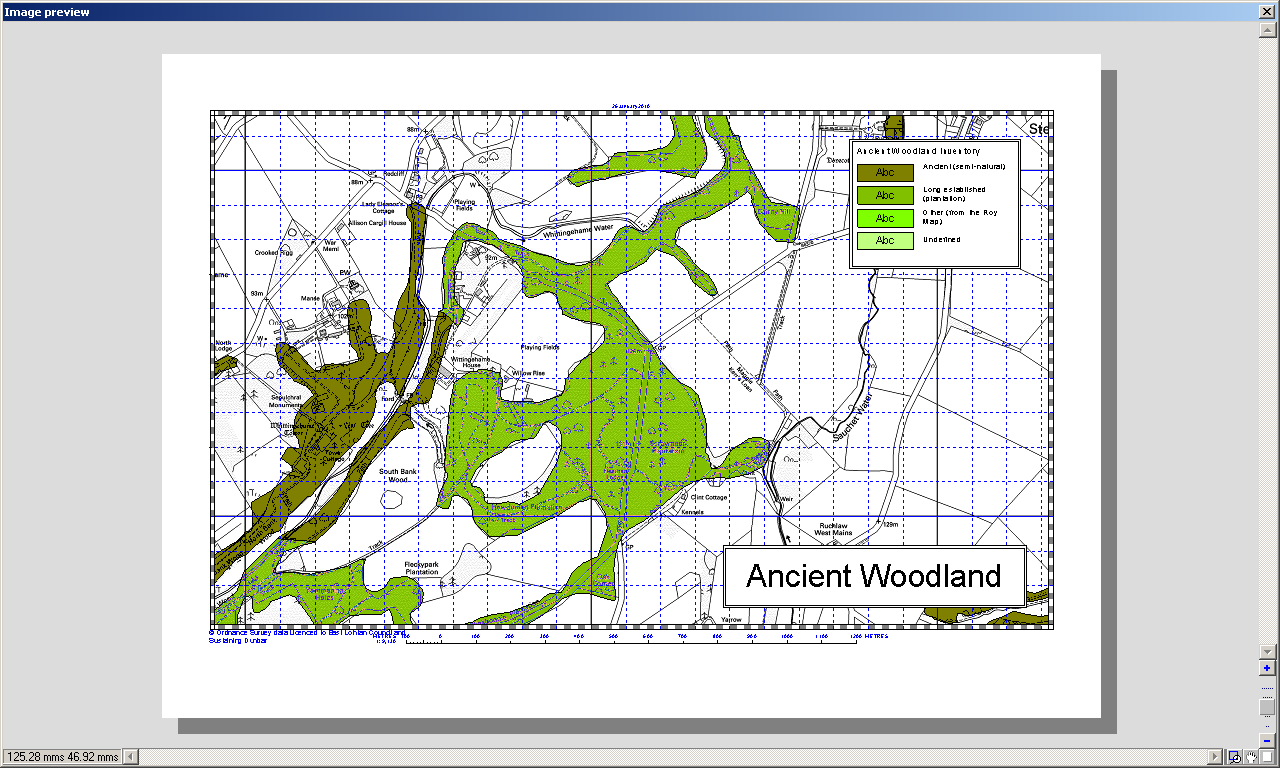
You may have noticed that the OS map changed from 1:50k to 1:25k (both colour maps) and then to 1:10k (a black and white map). Your final view should be 1:10k and look like the image on the right – click Esc(ape) to reclaim the screen:
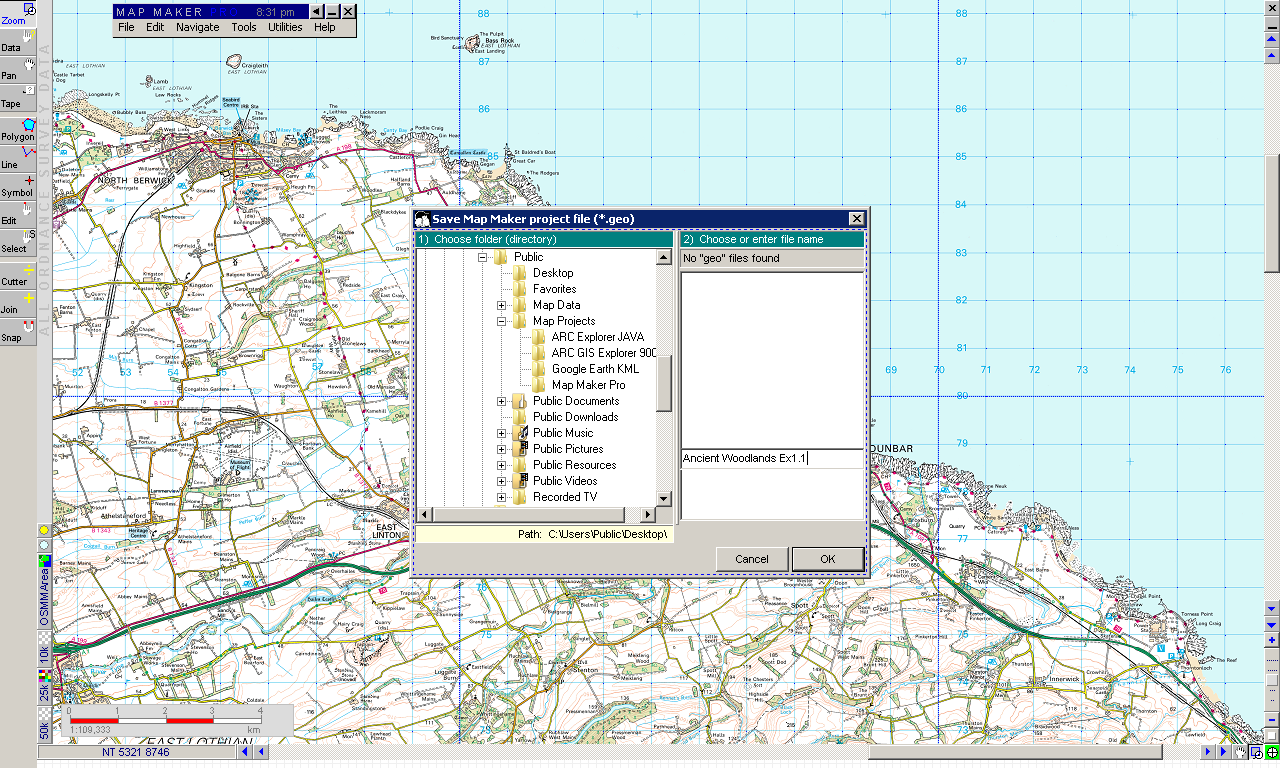
Now go to Save Project As in the File menu. Use the scroll bar to navigate to the Desktop, where you will save your 1st project. Note the path is given below the left hand pane. Now give it a name, bearing in mind that the .geo will be added automatically so you can start writing immediately. Hit OK to save.
Click n the image to see the dialogue box. Hit Esc(ape) to return here.
The overall task is to display Ancient Woodland boundaries over a suitable OS map, add a map key, create a legend and title and print it.
Print Woodland Map
This exercise is for complete beginners and should not be too challenging unless you if you are unfamiliar with Windows file management or configuring multi-level tabbed dialogue boxes.
You’ll learn about:
the Project Manager
how to save project files
basic layer manipulation
linking to a database
changing the map style / key
creating a project legend
creating “map furniture”
basic printing
So lets start right away.
Start Map Maker. If Map Maker is already open, close it down and restart it.
The screen should show a 1:50k view of Dunbar and District.
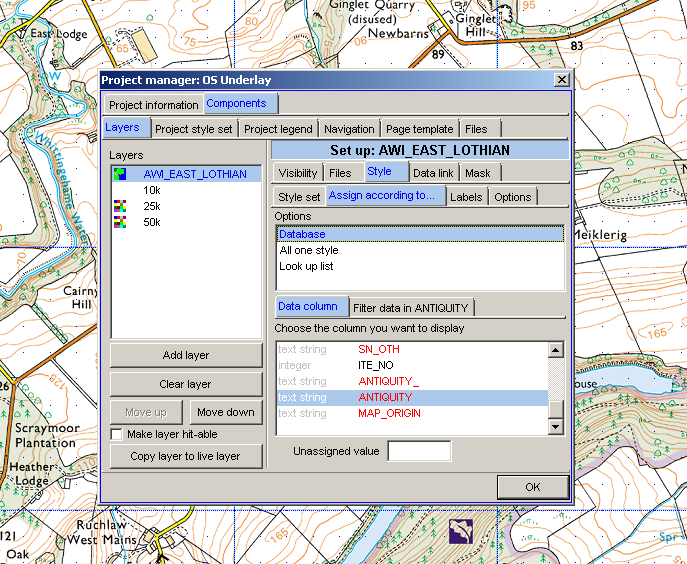
Vector data can have other data associated with it. This data is a simple database (.dbf), similar to and editable in an excel spreadsheet, arranged in rows (records) and columns (fields).
This database can be used to perform simple or complex queries and, crucially, to colour i.e. style your maps to help you create useful keys to explore and present your data.
When you first add a layer from a third party data set, you will have to link to the database in order to style using the database. You can always link to the database later, and there are 2 different options for linking to a database.
When styling, you will need to point to an appropriate field. When using third party data, make sure you’ve examined the database carefully before you start linking to it.
Inappropriate linking can slow Map Maker operations down considerably or cause it to hang / crash. Usually only a handful of fields are usually suitable for rendering text based keys or labels, while range-based keys can only use numerical or integer fields.
All Map Maker projects use Layers, transparent sheets of data overlaid one upon the other.
Layer Types
A map project can be thought of as a combination of several layers, arranged and styled in a particular way and ready for use in the field, for a presentation or for publication.
A layer on the other hand is simply a data set, with or without an underlying database, with or without styling. A map project has a context, whereas the data may have only limited contextual information associated with it. In other words a layer comprises a discrete set of data rather than a finished map.
Map Maker like other GIS packages uses 2 main types of map data:
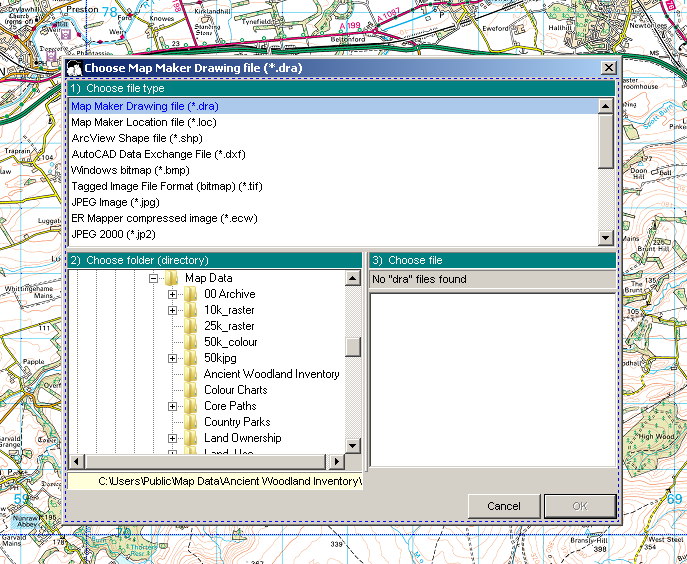
Vector: polygons, lines and points, defined by a set of coordinates (x and y). Map Maker uses it’s own native format to save these data identified as .dra
Raster: digital images i.e. made up of pixel squares and save in any number of picture formats, which are not specific to Map Maker. Most Raster data will come as a collection of tiles either maps, air photos, satellite imagery or a digitally derived data set.
In Map Maker, unlike some packages, mixing vector types within a layer is possible, but we do not recommend it. Text and arrows are another Vector type in Map Maker, but more of this later when we talk about editing Vector data.
Raster data needs a little more information than is available in the digital image alone for it to be useful in map presentations. Co-ordinate information is held separately in a so-called “world file”, which will have been saved alongside the .tif images as a .tfw. Without co-ordinate information, it is impossible to create tiled views or overlay other data sets correctly. If your tiling is not working, the .tfw may be missing or corrupted.
Finally, it is possible to import a number of non-native data sets into Map Maker. The most common one, is the .shp format (by ESRI the Makers of Arc GIS).
Map projects can combine Map Maker’s .dra format, with Arc layers (.shp) and digital image files (.tif). It is possible to convert files from format to the other, and in some instances – large data sets – it is highly advisable to convert .shp into .dra. There are Utilities available to do this along with image manipulation.