Over the past few months I’ve been experimenting with ways to make the East Lothian Field Names project easier to maintain, easier to review and more transparent to contributors. The result is a small but surprisingly useful prototype that now runs automatically each week.
In brief
Every Sunday morning the system now:
- Downloads the latest field name data directly from the National Library of Scotland’s GeoServer.
- Creates a dated archive snapshot of the dataset.
- Updates a public GeoJSON file.
- Refreshes a live map hosted on Felt.
- Re-sorts the map legend automatically so farms appear in alphabetical order.
- Compares the latest data with the previous week’s snapshot.
- Produces a management report showing what has changed.
The intention is not to replace existing workflows but to provide a lightweight way of monitoring progress and spotting potential issues.
Why?
The project database is continually evolving. New farms are being researched, new names added and existing records refined as evidence surfaces. Previously there was no easy way to answer questions such as:
- Which farms were updated this week?
- How many new field names were added?
- Are there records with missing or inconsistent information?
- Where on the map are the latest additions?
The underlying data contained the answers, but extracting them required manual effort.
The data pipeline
The starting point is the project’s WFS (Web Feature Service) layer hosted by NLS. A scheduled task downloads a fresh GeoJSON copy each week and stores it as a dated snapshot. This creates a historical archive of the database at different points in time.
For example:
fieldnames_2026-06-07.geojson
fieldnames_2026-06-14.geojson
fieldnames_2026-06-21.geojson
A separate latest.geojson file always points to the most recent version.
Automatic map updates
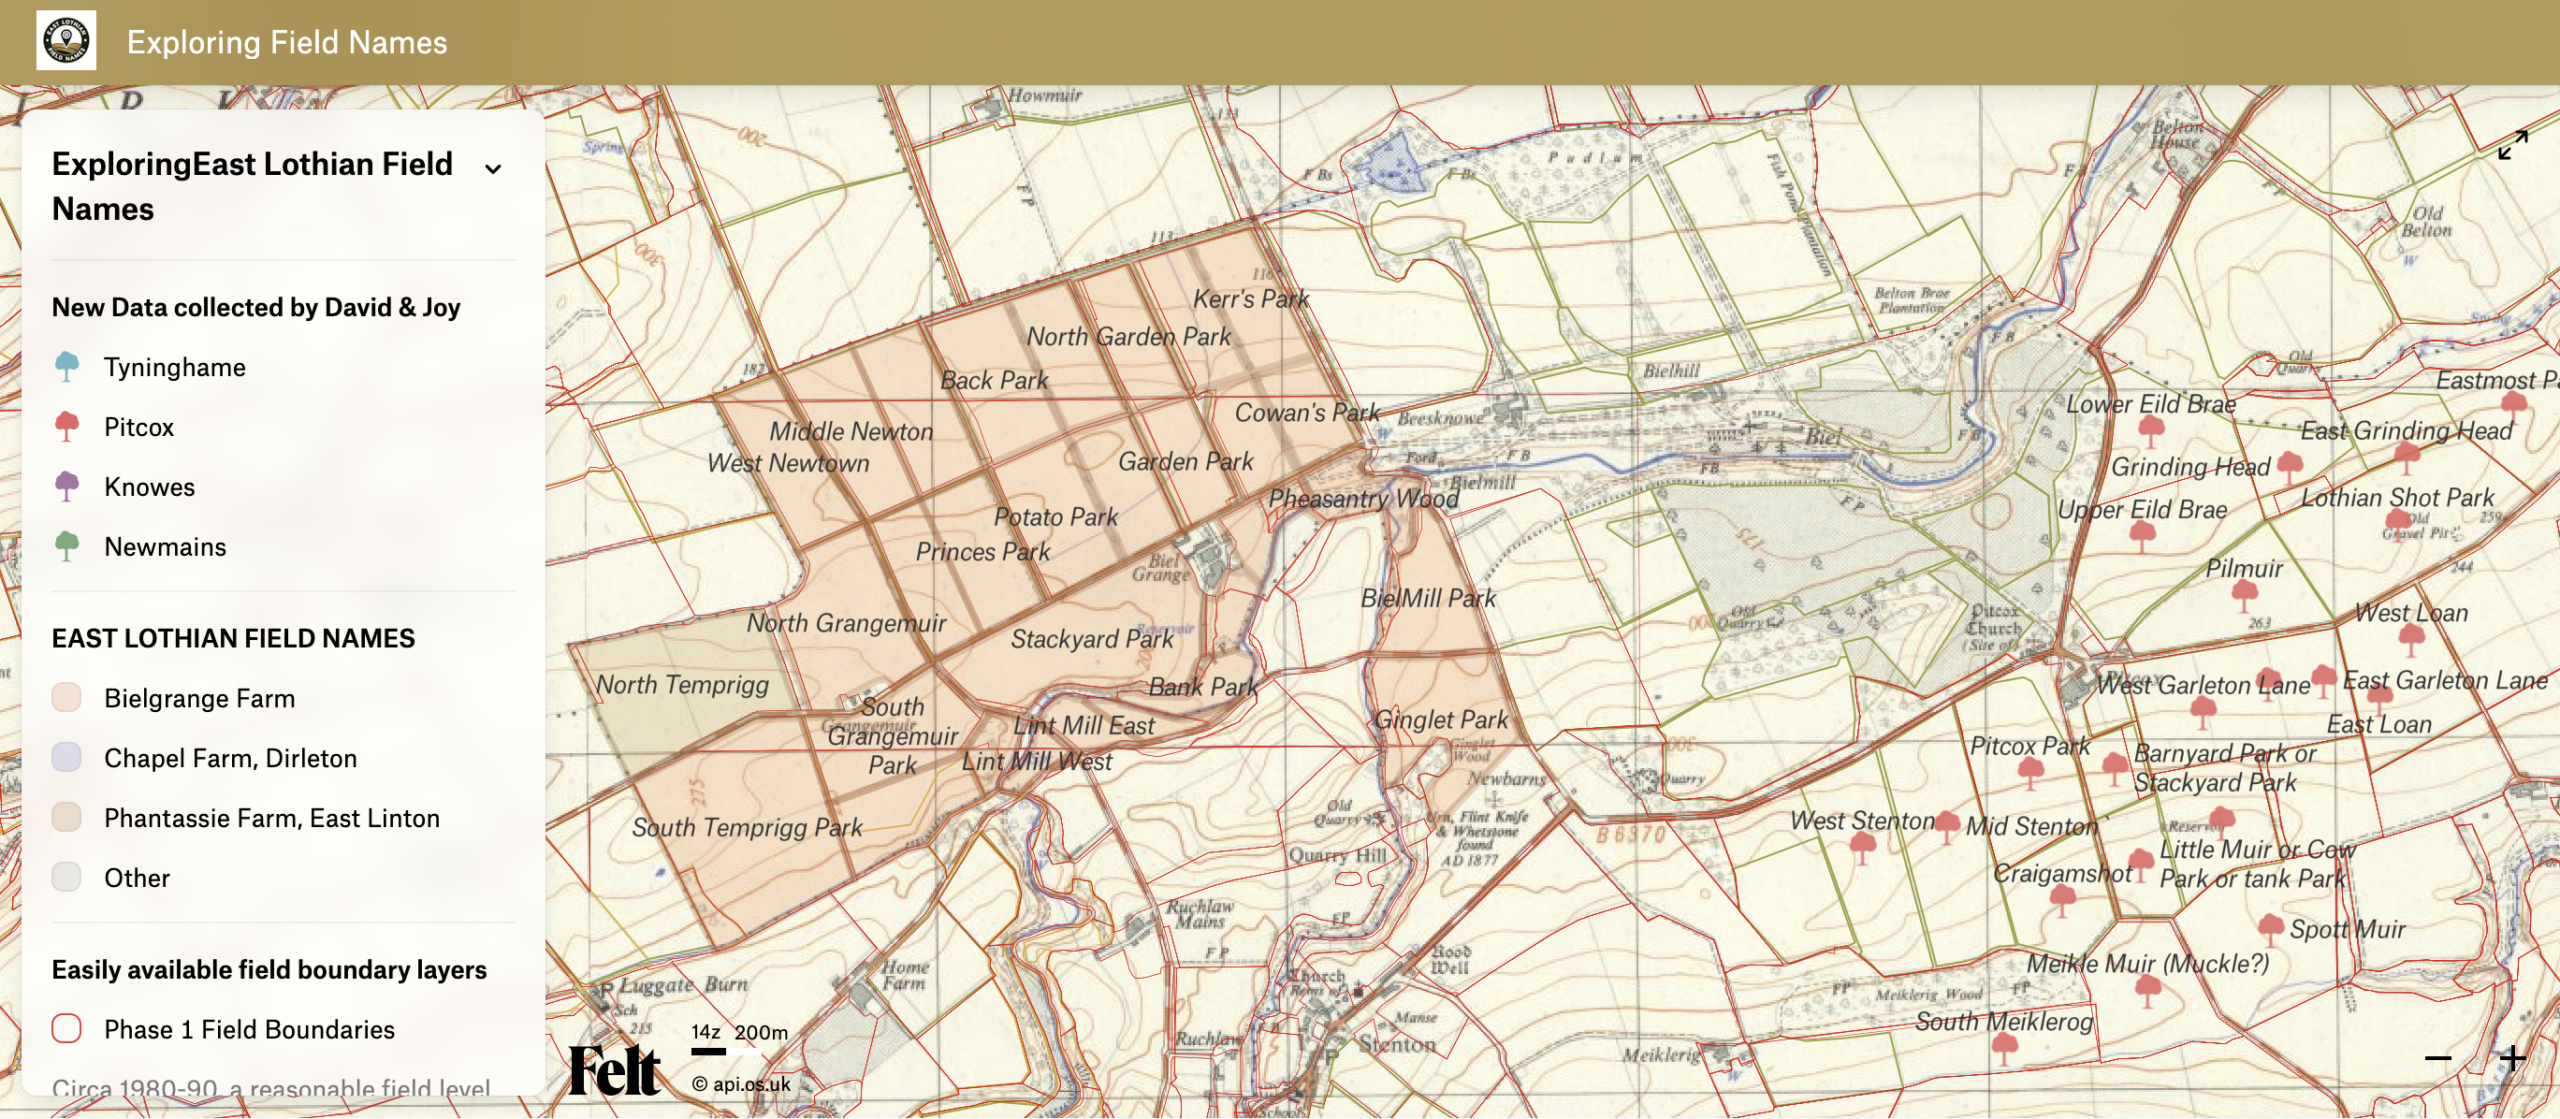
The project backup map is hosted on OurLocality and diplayed using Felt, through the Felt API. Rather than manually re-importing data, the system triggers a layer refresh automatically whenever a new GeoJSON snapshot is published.
As a result, a public weekly snapshot of the map stays synchronised with the database without any manual intervention.
An additional script reorders the categorical legend so that farms appear alphabetically and in the order they happen to arrive from the source data.
Weekly change reports
The most interesting part of the prototype is the reporting system. Each week the latest snapshot is compared against the previous week’s version using the unique database identifier (gid) assigned to every field.
The report identifies:
- newly added records;
- records that have been updated since the previous snapshot;
- farms showing recent activity;
- total field counts;
- total farm counts.
The reports are published as simple HTML pages and archived for future reference:
https://ourlocality.org/nls-fieldnames//latest_changes.html
Linking reports back to the map
A useful enhancement are the map links.
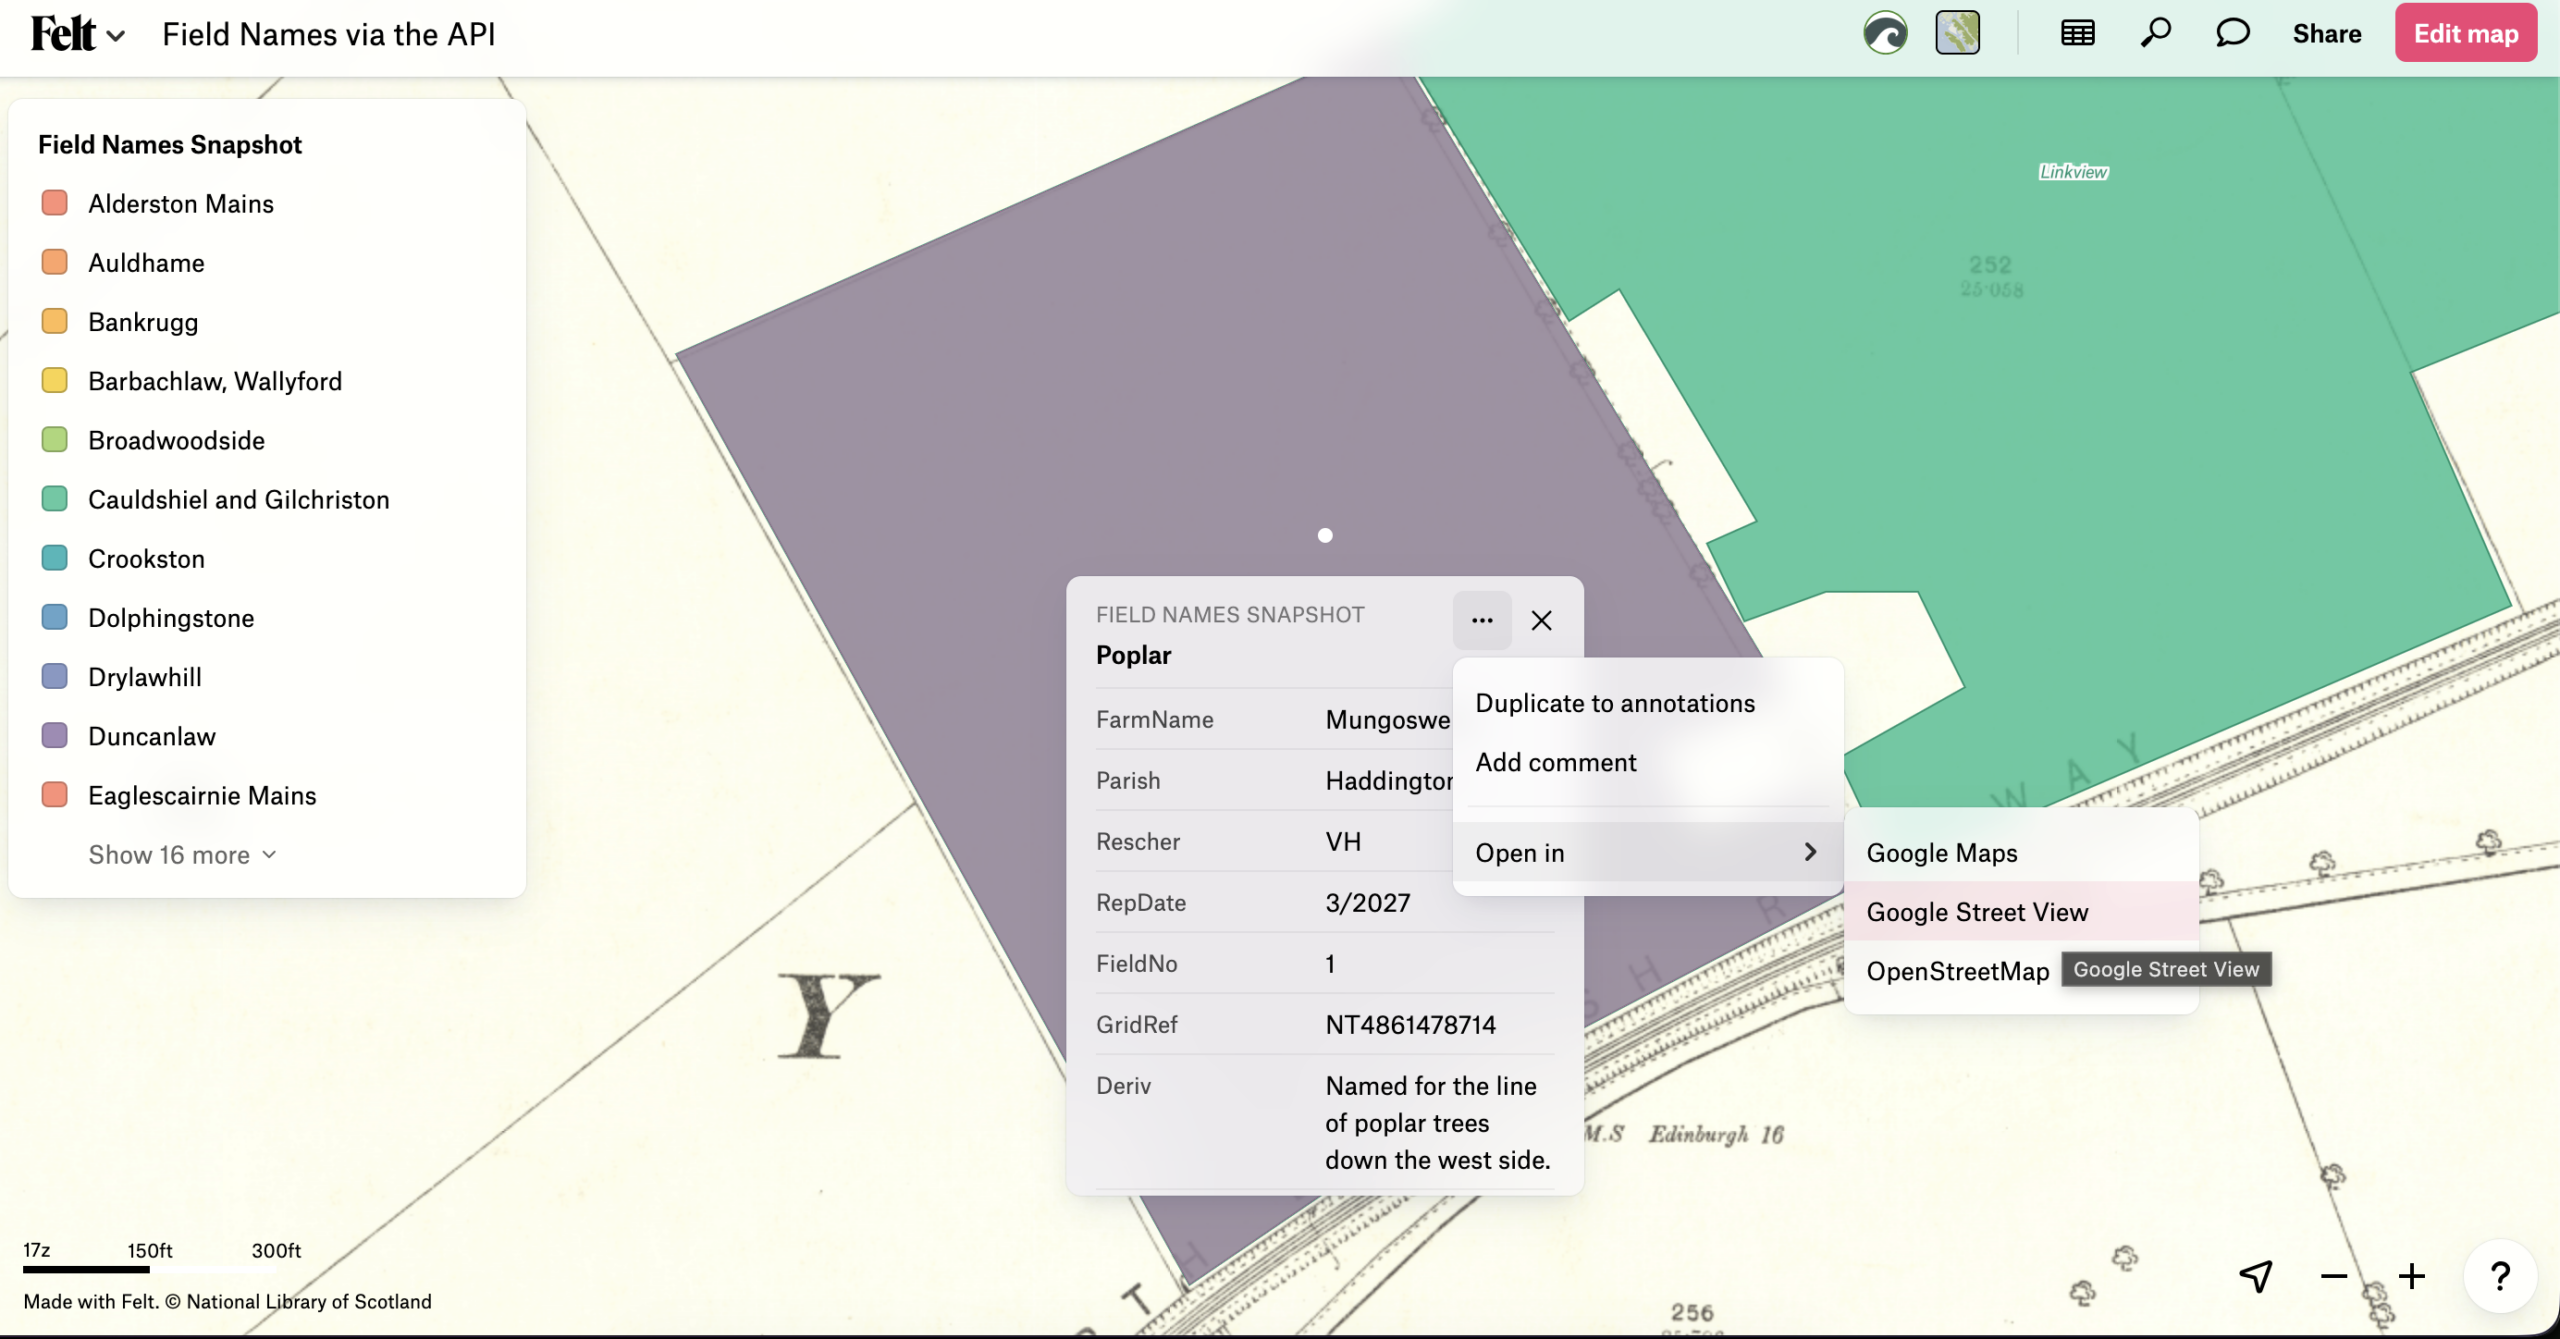
Every farm and newly-added field can now be clicked from the report, opening the Felt map centred on the relevant location. The code finds the centroid of the field or the farm – an approximate centre and zooms in.
This makes it possible to move directly from a management report to the mapped feature.
Benefits
The reporting process should reveal data quality issues that might otherwise go unnoticed.
For example, missing farm names or incomplete records become immediately more visible as they stand out in the weekly summaries.
In that sense the reports are acting not only as progress monitoring tools but also as a lightweight quality assurance system.
Current status
This remains an experimental prototype rather than a finished product.
The core workflow is now functioning reliably:
- automated backups;
- automated map refresh;
- automated legend sorting;
- weekly change detection;
- archived management reports.
Possible future developments
Several ideas are already under consideration:
- highlighting changes directly on the map;
- email summaries of weekly activity;
- farm-level activity timelines;
- charts showing project progress over time;
- integration into the project website;
- additional data quality checks;
- researcher activity metrics.
Feedback welcome
The main aim of this work is to help with administration and make it easier to understand how the project is progressing. The prototype is already producing information that would previously have required considerable manual effort to assemble.
As with any prototype, the most valuable next step is likely to come from people using it. Suggestions, criticisms and new ideas are therefore very welcome as the system continues to evolve.